A heat map tool is a powerful software application that enables businesses to visually analyze data and gain valuable insights. It utilizes color-coded visual representations to highlight patterns, trends, and hotspots within complex data sets. With a heat map tool, you can easily identify areas of high customer engagement, website traffic, user behavior, and more. By providing a clear and intuitive display of data, heat maps help businesses make informed decisions, optimize their strategies, and improve overall performance. Whether you’re a marketer, website owner, or business analyst, harnessing the power of a heat map tool can greatly enhance your ability to understand and leverage data for intelligent business applications.
What is a heat map tool?
A heat map tool is a software application that visualizes data using colors to represent different levels of intensity or value. It takes numerical or categorical data and presents it in a user-friendly and interactive format, allowing users to easily understand patterns, trends, and relationships within the data. Heat maps are commonly used in various fields, such as business analytics, web design, market research, and even in healthcare. These tools enable businesses to make informed decisions, optimize processes, and enhance user experiences.
Understanding Heat Maps
Heat maps are essentially graphical representations of data where each data point is depicted by a color, ranging from cool colors like blue or green to hot colors like yellow or red, depending on its intensity or value. The hotter the color, the higher the intensity or value of the data point. This visual representation helps users to quickly identify patterns, outliers, and areas of interest within the data set.
Heat maps can be constructed using various types of data, such as geographic data, website visitor data, customer behavior data, or any other data set that can be plotted on a two-dimensional grid. The patterns and variations in colors allow users to understand the underlying data in a more intuitive and efficient manner compared to traditional tables or charts.

Types of Heat Maps
There are different types of heat maps, each used for specific purposes:
-
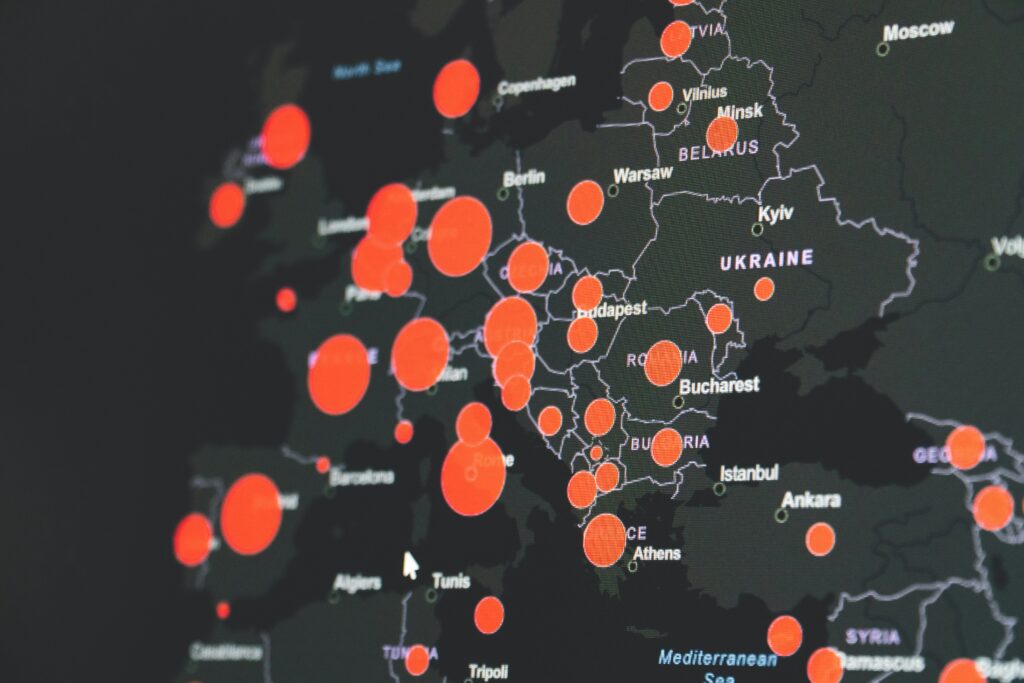
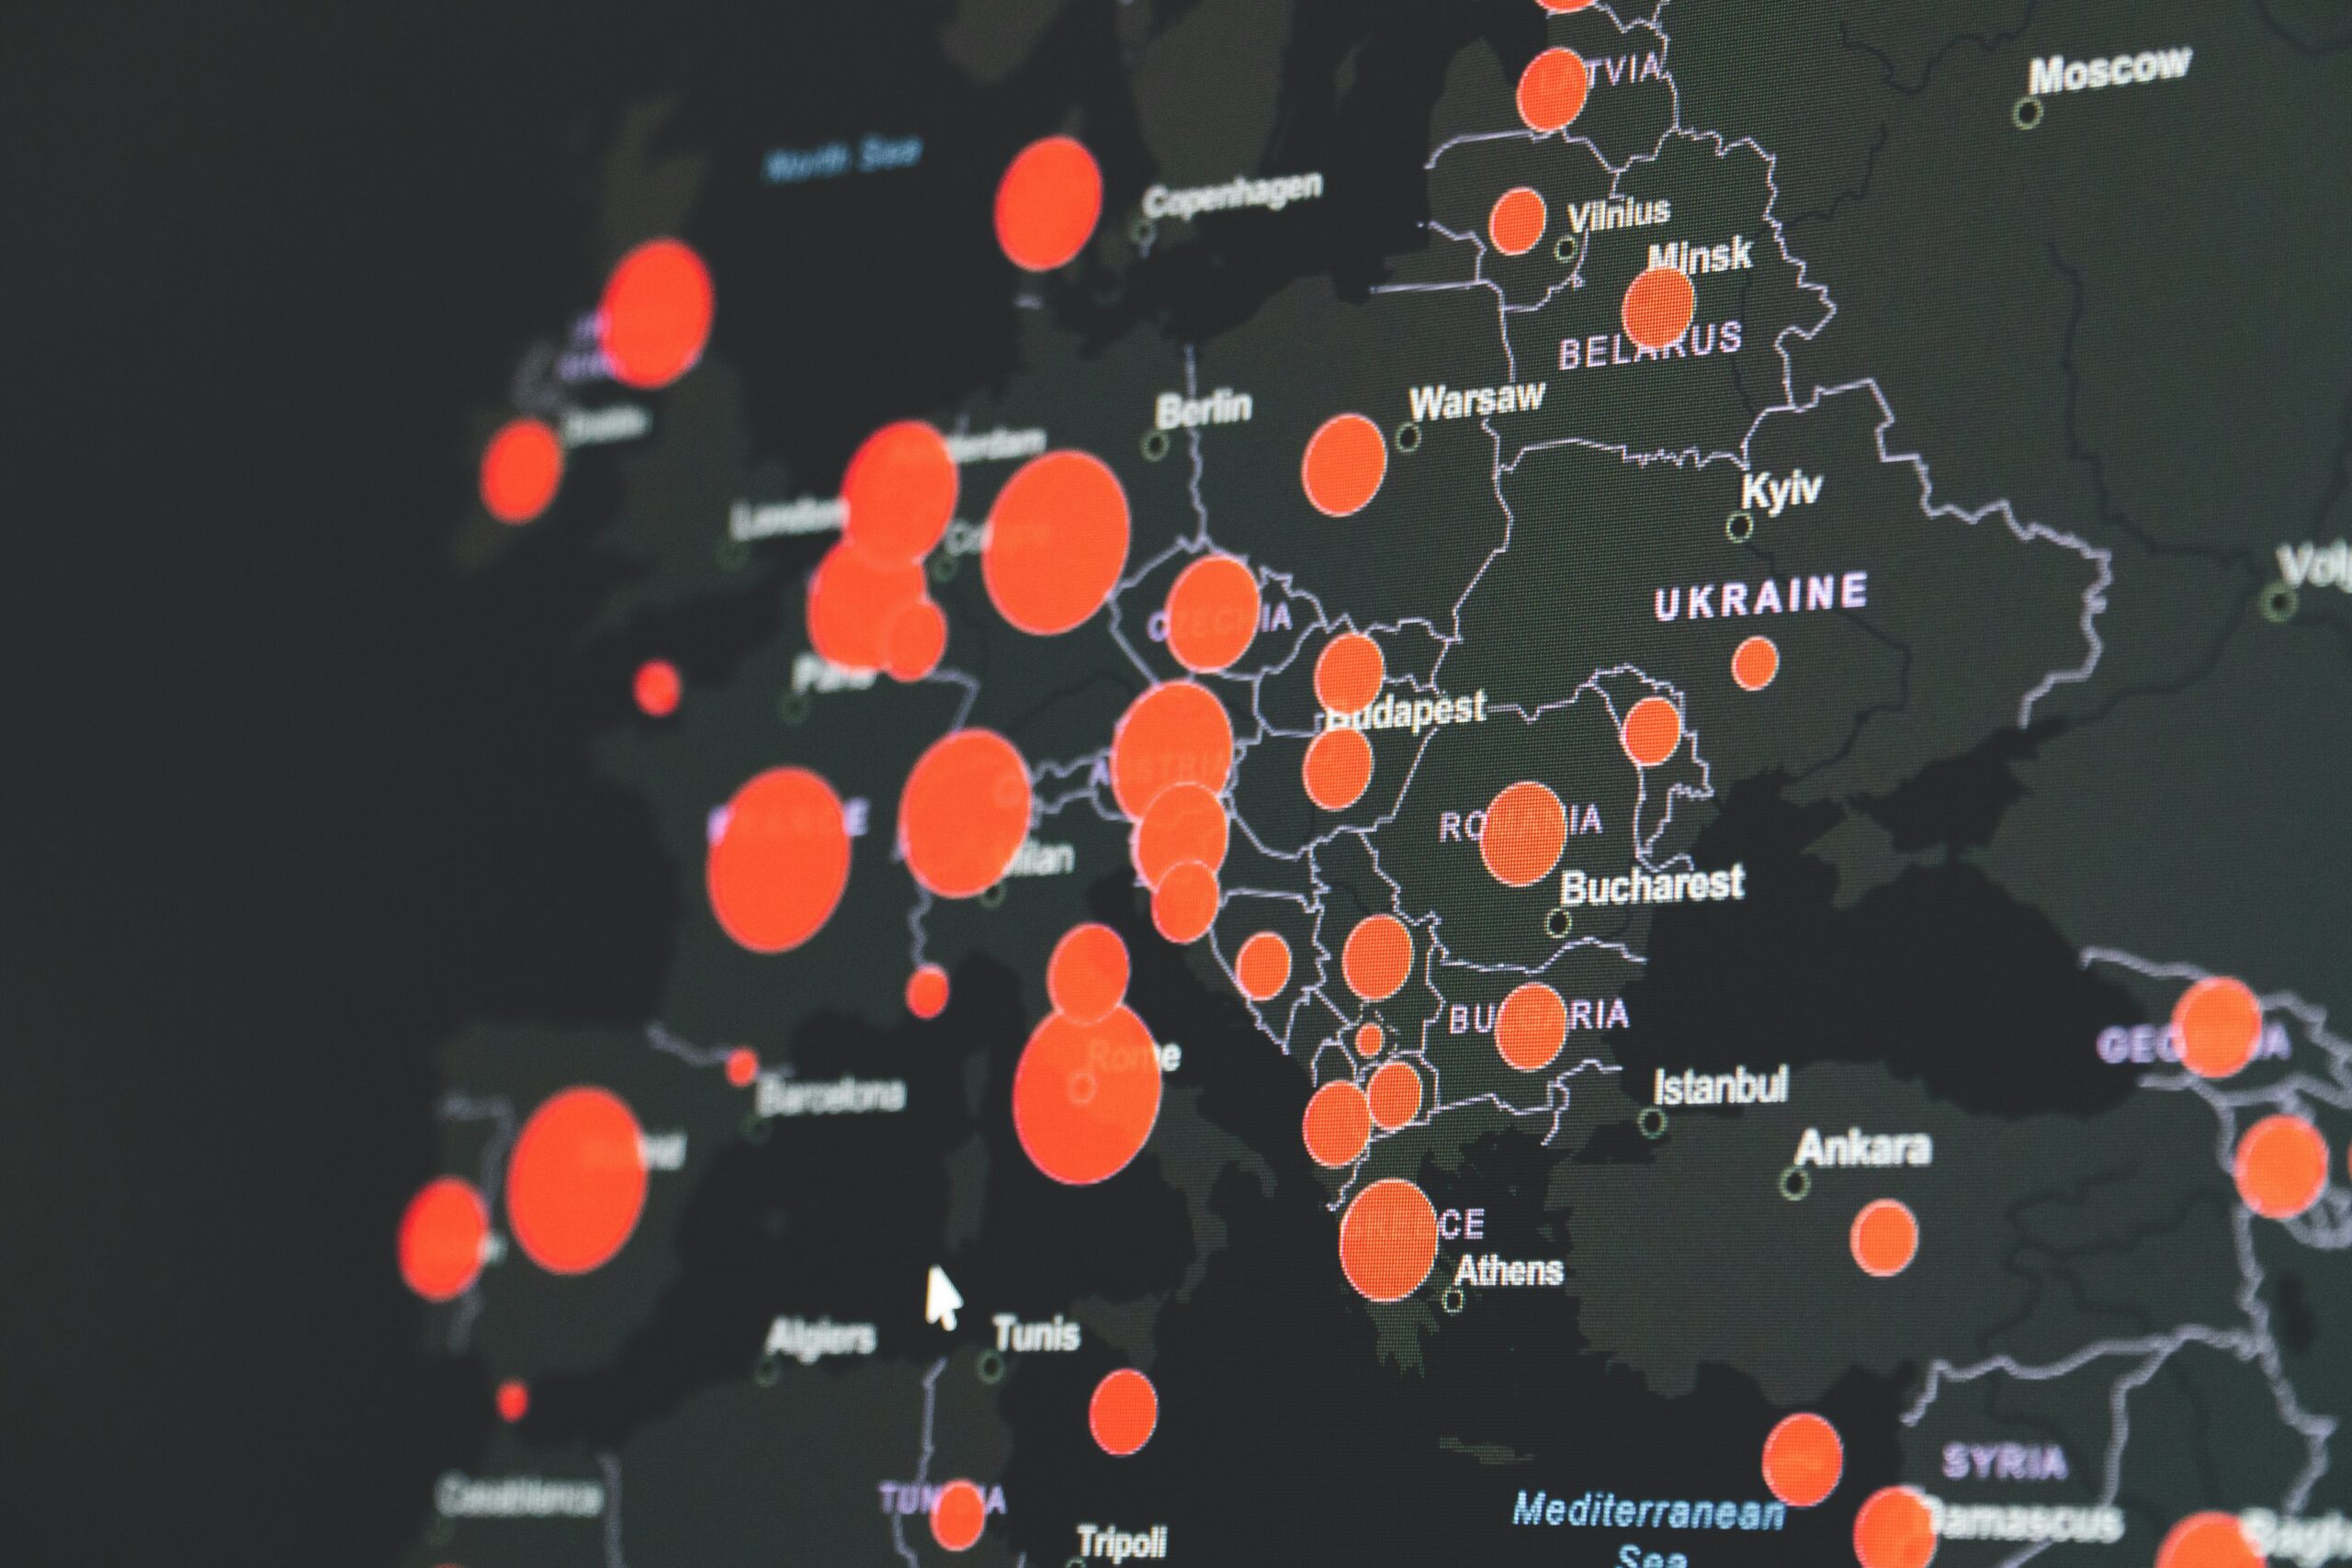
Choropleth Heat Maps: Choropleth heat maps represent data aggregated by predefined geographic regions, such as countries, states, or zip codes. These heat maps use colors to convey the intensity of a particular variable, such as population density, crime rates, or average income, across different regions.
-
Click Heat Maps: Click heat maps are commonly used in web design and UX optimization. They track and visualize users’ mouse clicks or touches on a webpage, showing where users are most frequently interacting. By analyzing these heat maps, businesses can identify areas that receive the most attention and make informed decisions on website layout and design.
-
Scroll Heat Maps: Scroll heat maps track users’ scrolling behavior on a webpage, showing how far users scroll down a page and where they spend the most time. This provides valuable insights into user engagement and helps businesses optimize the placement of important content and calls-to-action.
-
Eye-Tracking Heat Maps: Eye-tracking heat maps use specialized hardware or software to track where users’ eyes focus on a screen or webpage. By visualizing these gaze patterns, businesses can better understand which elements attract the most attention and improve the visual hierarchy of their designs.

Benefits of Using a Heat Map Tool
Using a heat map tool offers several benefits for businesses and individuals:
-
Data Visualization: Heat maps provide a visually appealing and easy-to-understand way of representing data. They condense complex information into intuitive visual patterns, allowing users to quickly grasp key insights without having to interpret raw data.
-
Identifying Trends and Patterns: Heat maps highlight trends, patterns, and outliers within the data, making it easier for users to detect relationships and make data-driven decisions. By identifying hotspots and cold spots in the data, businesses can better understand what is working and what needs improvement.
-
User Behavior Analysis: Heat maps, such as click and scroll heat maps, help businesses analyze user behavior on websites or mobile apps. By understanding where users click, scroll, or spend the most time, businesses can optimize their user experiences, improve conversion rates, and increase customer satisfaction.
-
Optimizing Website Layout and Design: Heat maps are valuable tools for optimizing website layout and design. By analyzing click heat maps, businesses can identify which elements attract the most attention and design their websites accordingly. Scroll heat maps help businesses determine whether users are engaging with all the content on a page or if they are dropping off at a certain point.
-
Making Informed Decisions: Heat maps provide valuable insights that can inform decision-making processes. Whether it is improving website usability, optimizing marketing campaigns, or enhancing product offerings, heat maps empower businesses to make data-driven decisions based on user behavior and preferences.
Overall, heat map tools are powerful assets for businesses and individuals seeking to understand and interpret data in a more visual and intuitive way. By utilizing heat maps, businesses can gain valuable insights, optimize processes, and ultimately improve their bottom line.
